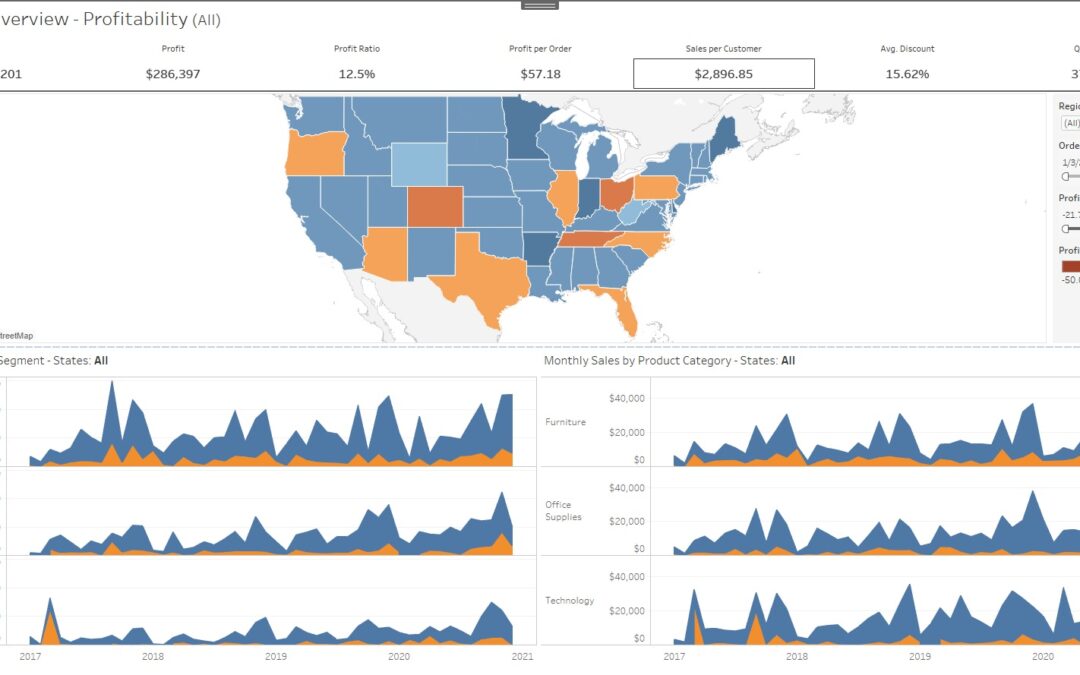
I’ve been working on getting certified for Tableau, one of the most well recognized Data Visualization Tools in Marketing and Data Analytics. A lot of the charts and graphs you see on the news and other media are developed with Tableau, along with internal reports and dashboards for major corporations, sales teams and finance.
I’m creating this as a study guide and to reinforce the knowledge before I take my Exam – super excited. It’s actually anticipated to be difficult because it involves a lot of memorization since I’ve taken the practice tests. But these are just more universal terms in Tableau and Data Science/Analytics in general, as that is what I felt I had the most difficulty with.
As I’ve described previously in my post, Finance and Data Analytics, I’ve always had a knack with the variables in a given problem. It has allowed me to devise the Emissions Tax Plan – Tableau will help me devise a more compelling story. Nothing can beat a good visual. Imagine being able to create and embed this.
Additionally, I’m looking at good Data Sources like Statista and USASpending.gov. Be sure to let me know if you got any more sources.
Tableau Definitions, Terms, Notes
If you’re gonna talk data science, visualization, marketing jargon and sound smart, you can throw out some cool terms with this. If you want to pass the Tableau Certification Test and make the big bucks, you have to actually understand the software and all of the terms and definitions.
Tableau Basics Guide – Data Analytics/Marketing Notes
Tables: Yes, I know – this is basic stuff, but it actually tripped me up a lot. A data table is a number of columns and rows with individual fields of data. Think your typical spreadsheet. Tables show individual fields, or values, in a cross tab – X and Y axis.
Tableau Data Field – Each column of data from a table is a field
You cannot modify the source data with Tableau – including the name. However, you can change the metadata – name displayed, hide data from the view, organize in folders, .
Tableau Workbooks and Sheets are:
Worksheets – Build views of data by dragging and dropping on shelves.
Dashboard – Several views (worksheets) combined to present or monitor.
Story – A sequence of work sheets or dashboards used to tell a story and convey pertinent information.
Types of Layers in Tableau – New Data Modeling
Data is organized differently in Tableau now, starting with Tableau 2020.2 – data sources come in two different layers.
Physical Tables remain distinct.
Logical Tables are merged into a single, flat table. You must use relationships between two logical tables. You can only use joins with physical tables physical tables if contained in a logical table.
Types of Data Files in Tableau
Dimension – Independent variable field, produces headers when put into rows or column shelves. Qualitative, categorical data by default – dimension.
Measure – Dependent Variable, numerical, quantitative value dependent on one or more values.
Green Pill in Tableau – continuous field, Created the Axes
Blue Pill – Discrete, Dimensions
Meta Data – you can make edits from the Data Grid
Types of Tableau Files:
.tbwx file – Tableau Packaged Workbook: complete Tableau file containing workbook and all external data
.tde file – Tableau Extract File – faster, can be used independent
.tds file – Tableau Data Source: data modeling including data types, fonts, colors, settings, or metadata
.twb file – Tableau workbook
Viz – a Tableau Visualization
Data Attributes
- Folder structure
- Measure and dimension conversions
- Field data types (e.g., strings, integers, dates)
- Field properties (e.g., how a field is displayed or aggregated)
- Attributes (e.g., field names)
Dimensions – Field that is an independent variable, contains qualitative, categorically fixed data (breed, race, brand)
Measures – Field that is a dependent variable, typically produces Axis, quantitative (numeric) data (totals, sums, averages)
Tableau Bins – Create equal sized containers of data, used to display a specific range off data in a chart or graph. Cannot be calculated fields
Top N Field – “N” is user defined, will deliver the Top “N” Results , ex. Top 10,15, 25 records
Groups, Hierarchies, Relational Data
Calculated Fields, Calculations –
Box and Whisker Plots
Tables – Common Field Name
Append Data with Unions
3 ways to group data –
- Tableau Marks – Displays data using marks; every mark corresponds to a row or row group
https://help.tableau.com/current/pro/desktop/en-us/buildmanual_shelves.htm
2) Labels
3) Dimensions shelf.
Tableau Data Interpreter
Uses AI to clean up dirty data; only with Excel or .csv files. Cleans up extra columns, merged columns and headers.
Working With Large Data Sets in Tableau
Extracts work fast, and with up to billions of instances. When working with large sets of data, it’s best to use an extract over a live data set.
Types of Calculations
Table Calculations
Table calculations address direction.
Aggregated Fields
Aggregated and non-aggregated fields cannot be combined. They are calculated fields.
Tableau Extracts
Tableau Extracts are are subsets of data saved into a .tde file. They are great for working with large sets of data, and improve performance by working with only the important data you want to work with. They provide offline access to data and allow functions that aren’t available on full data sets.
Combining Data in Tableau
There are different ways to combine data in Tableau – the main four are Joins, Relationships, Blends and Unions.
Types of Joins in Tableau
There are 5 main types of Joins in Tableau –
Left Join – New table has all values from left table, and only matched from right table.
Inner Join – Combines tables into one that has matched values; un-matched dropped completely.
Full Outer Join – Contains all values from both tables, un-matched values have a null value.
Right Join – New table has all values from right table, and only matched from left table.
Join Clauses – Determines which fields are used and how to complete a table join in Tableau. There are pre-determined clauses, or custom.
See more here.
What is a Tableau Union
Joins multiple tables from the same data source by using the wildcard search option. To do this – click New Union on the Data Source Tab in the bottom left of Tableau.
Union Data – appends rows from one table to another.
Blending Data – Displays two sources of data in one view
Differences Between Joins and Relationships
Relationships – are a dynamic, flexible way to combine data from multiple tables for analysis. We recommend using relationships as your first approach to combining your data because it makes data preparation and analysis easier and more intuitive. Do not merge tables together. Handles nulls.
Relationships must be used between logical tables.
Joins – are a more static way to combine data. Joins must be defined between physical tables up front, before analysis, and can’t be changed without impacting all sheets using that data source. Joined tables are always merged into a single table.
Learn more here.
Types of Tableau Filters
Data Source Filter – restricts users from seeing certain types of data
Extract Filter – Pre-Condition filters before the extract
Context Filter – Discrete, create a filter to be applied first, create a dependent numerical or Top N filter
Measure Filter – Aggregate data such as sum, average
How to create Tableau Filters
Quick Filters –
Logical Tables –
Physical Tables –
Quick Table Calculation
Types of Charts
Area charts
Pareto chart –
Bar chart – Requires two data sources
Box plot
Line chart
Scatter plot
Histogram – Requires only one data source
Bullet Graph – Bar market with additional information that shows progress towards a goal, uses two measures
Aggregation – SUM, MIN, MAX, AVG, COUNT
Measure, measure field
Alias
Discrete Dimension
Aggregated Measure
Sets – Custom Fields that define a subset of data – compare and ask questions about a subset of data.
Dynamic Sets only on one dimension
Calculated Fields –
Difference between measures and fields –
dual axis chart – Combining multiple axis charts
Parameter – Float, Integer, String – Single select only.
concatenate – connect or link together
Great Data Sources for Tableau
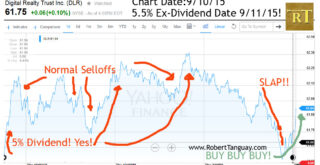
I’ve actually been compiling my own data for www.ScrubMoney.com, and am going to be releasing a really cool stock data visualization. I started by doing the donkey work and manually entering the data for individual stocks into an Excel spreadsheet.
Then, I added some basic formulas and I have a pretty nifty spreadsheet. Finally, I put the data in Tableau and made some basic visualizations. Whats cool is I have a live snapshot of the data from December of 2021, and then just updated the data – that will create something really cool.
If I had a live connection to this data would be best, like a broker account or trading desk. Please let me know if you have the info on that. If not – just sign up for the newsletter at the top right of every page here.
In a completed project, I got data from Trading Economics, put it in a spreadsheet, did a simple calculation for GDP Per Capita, then loaded it up to Tableau. This is called Pollution and GDP Per Capita on EmissionsTax (my environmental website).
I don’t have the pollution data yet, however, you can see the correlation by using knowledge most people have.
Other Data Sources and Tips
As I mentioned at the beginning of this guide, Statista and USASpending.gov are great places from my understanding. Basically any place you can find data in a .csv or Excel file, and therefore, you can turn it into a data visualization.
WorldoMeters.info has some pretty crazy stuff.
The art comes from telling the story through that visualization and showing the meaning.
Rather than make this Tableau Study Guide perfect, what makes it the best is it will continue to be updated. Find I’m missing info or got something wrong?
Have a question that isn’t here or clear? Hit me up or leave a comment bellow!


Let’s Talk